


Россия
с 01.01.2013 по настоящее время
Финансовый университет при Правительстве Российской Федерации (Центр научных исследований и стратегического консалтинга, ведущий научный сотрудник)
сотрудник с 01.01.2022 по настоящее время
Люберцы, г. Москва и Московская область, Россия
ВАК 08.00.05 Экономика и управление народным хозяйством (по отраслям и сферам деятельности, в том числе: экономика, организация и управление предприятиями, отраслями, комплексами; управление инновациями; региональная экономика; логистика; экономика труда; экономика народонаселения и демография; экономика природопользования; экономика предпринимательства; маркетинг; менеджмент; ценообразование; экономическая безопасность; стандартизация и управление качеством продукции; землеустройство; рекреация и туризм)
ВАК 08.00.10 Финансы, денежное обращение и кредит
ВАК 08.00.13 Математические и инструментальные методы экономики
ВАК 08.00.14 Мировая экономика
УДК 33 Экономика. Экономические науки
ГРНТИ 06.81 Экономика и организация предприятия. Управление предприятием
ОКСО 38.02.01 Экономика и бухгалтерский учет (по отраслям)
ББК 65 Экономика. Экономические науки
Цель: в статье рассматриваются особенности экономического анализа как особого направления изучения деятельности бизнес-единицы, позволяющего с помощью обработки информации, полученной в результате аналитических процедур, выбрать наиболее рациональную альтернативу перспективного стратегического планирования компании. Методология / Подход: в статье описывается возможность повышения эффективности от использования стратегического анализа и, в частности, от включения в методологию статистических методов и методов оценки деловой репутации компании. В качестве информационной базы исследования используются труды ученых по проблемам теории и методики анализа финансового состояния, а также публикации, сделанные авторами в ходе исследования. Также использовались коэффициентные методы, методы оценки компании и методы оценки репутации компании. Результаты: Практическая значимость данного исследования состоит в обосновании применения статистических методов и методов оценки компании в рамках экономического анализа с целью разработки или выбора стратегий развития организаций. Практические последствия: Это исследование принесет пользу экономистам, аналитикам и научным исследователям, которые реализуют различные методы экономического анализа на практике с точки зрения возможности дополнения их как методами стратегического анализа, так и методами оценки. Оригинальность / ценность: Основная тема, которая рассматривается в статье, - это практическое применение методов экономического анализа и выбор направления перспективного стратегического развития организации.
совокупный доход акционеров, добавленная рыночная стоимость, остаточный доход, добавленная экономическая стоимость, добавленная стоимость акционеров, добавленная денежная стоимость, модель Эдвардса-Белла-Олсона, квалиметрический метод
- Introduction
In a market economy, the primary objective of commercial entities is to maximise the economic performance expressed in the form of income or profit. However, taking into account the heightened market competition, achievement of this objective becomes difficult. This is especially evident in the context of the economic downturn, known as a cyclical phenomenon, which reflects the overproduction of goods and subsequent difficulties of their marketing [5]. New conditions for organizing and managing business required not only an introduction of new ways of conducting business, but also changes in the profile of the key functions performed by specialists to ensure the profitability of the organization. The organization’s leadership is obliged to involve specialists using scientifically based approaches, methods and ways of solving emerging issues.
2. Methods of financial statements analysis
2.1 Financial ratio method
As one of the methods, one can also consider the analysis of the financial statements using ratios, the main advantages of which are the simplicity, small amount of time and efforts used for calculation.
The summary of the studies allows proposing the following program for financial analysis using financial ratios [9].
1. Analysis of property (never heard of this term) status and capital structure. At this stage, the analysis of the allocation of capital and sources of its formation is carried out based on the balance sheet data. There are horizontal, vertical and comparative analyses of the balance sheet. Horizontal analysis consists of the construction of one or several analytical tables in which the absolute balance sheet values correspond with the relative values - rates of growth. Vertical analysis - the presentation of the financial report in the form of relative values, allowing to see the specific weight of each balance sheet item in its overall result. Horizontal and vertical balance sheet analyses supplement each other, and it is possible to build a comparative analytical balance sheet based on both analysis.
2. Analysis of liquidity, solvency and financial stability. This stage must begin with an analysis of the liquidity of the balance sheet, which consists of comparing the assets, grouped by the degree of their liquidity and listed in order of decreasing liquidity, with liabilities grouped by maturity and listed in order of increasing maturity.
3. Analysis of the effectiveness of the use of capital. At this stage, the main source of information for the analysis of the capital is the "Statement of financial results." This document allows you to see how the final financial result is obtained, the magnitude of this result both from the sales of goods, works, services, and from other operations, the number of payments due to the income tax, as well as the amount of net profit.
4. Analysis of the probability of bankruptcy. Globally, and more recently in domestic practice, various mathematical methods and models based on the calculation of individual financial ratios and their linear combinations are used to forecast the creditworthiness and assess the probability (threat) of bankruptcy. Each coefficient is considered with a certain weight, calculated based on multivariate discriminant analysis when examining a set of organizations. Models, as a rule, differ depending on the country, region and industry, so the mechanical transfer of, for example, the American model to Russian conditions is in most cases inappropriate [4].
2.2 Coefficient method
The method of analyzing the creditworthiness using a coefficient method has several disadvantages:
1. Comparative analysis of creditworthiness of Russian organizations is somewhat complicated due to the lack of an adequate regulatory framework and available average industry indicators (in foreign countries, rating agencies produce and regularly publish such information).
2. The intention to perform a comprehensive analysis of creditworthiness led to the development, calculation and superficial use of an excessive number of financial ratios. One needs to take into account that most of them are in a functional relationship.
3. The original financial reporting of the analyzed companies is distorted due to inflation processes in the Russian economy, which mainly affect not the vertical (ie calculation of specific weights), but horizontal analysis (i.e, the calculation of the absolute changes in the considered indicators).
In addition to analyzing the creditworthiness of the organization for a better forward looking strategic planning, the analyst should define of the company's value and assess its business reputation [7].
3. Value and establish performance indicators
3.1 The indicators of the first degree
To enable management to manage the company’s value and establish performance indicators for staff, they need a value indicator. The value indicators may be divided into two levels. The indicators of the first degree are calculated on the market base and indicate whether the increase in value has occurred during the analyzed period or not. They can only be used for public companies. These indicators include: total shareholder profitability (TSR, total shareholder return) and market value added (MVA, market value added).
1. Total shareholder return (TSR). The TSR indicator shows the profitability that the shareholder of the company receives for the entire period of ownership of the shares, if he reinvests the dividends received. The indicator can also be calculated for a certain period.
2. The MVA indicator is calculated as the difference between the market capitalization and the book value of equity, or as the difference between the market value of the enterprise (market capitalization + net debt) and invested capital (book value of equity + book value of debt).
3.2 The second-level indicators
The second-level indicators are calculated based on book value and / or cash flows and show whether the value increase has occurred in the analyzed period or not. These indicators include residual income (RI), economic value added (EVA), shareholder value added (SVA) and cash value added (CVA).
1. Residual Income (RI). Residual profit is calculated as the difference between the net income (NI) and the book value of equity (BVE) or as the difference between return on equity (ROE) and the cost of equity (Re) multiplied by the book value of equity (BVE). The positive value of RI shows that the management of the company for the analyzed period has increased the value for shareholders, and a negative value indicates the destruction of value.
2. Economic value added (EVA). Economic added value or economic profit is calculated as the difference between the net operating profit after taxation (NOPAT) and the amount of the company's capital servicing costs (IC * WACC), or as the difference between return on invested capital (ROIC) and weighted average cost of capital (WACC) multiplied by invested capital (IC). The positive EVA shows that the management of the company for the analyzed period has increased the value for shareholders, and a negative value indicates the destruction of value.
3. Shareholder value added (SVA). The SVA is calculated as the difference of the operational profit after tax (NOPAT) and the capital cost from stocks and bonds issues based on the weighted average cost of capital (WACC)
4. Cash value added (CVA). The indicator is calculated as the difference between the net cash flow before interest (CFBI) and the product of net asset (NA) and the weighted average cost of capital (WACC).
The above indicators are theoretically justified, but recent empirical studies show a weak connection with the market capitalization of the company. Therefore, the choice of the relevant indicator should be made based on the expediency, benefits and costs associated with obtaining the information necessary for its calculation.
4. Business reputation
4.1 Goodwill
The variety of approaches to the definition and methods of assessing goodwill has revealed the urgent need for standardization of accounting rules at the international level. This led to the emergence of two regulatory documents - IAS 22 "Accounting for Business Combinations" (1983) and IAS 38 "Intangible Assets" (1998).
The first standard that existed before 2004, classified goodwill for an acquired and internally created facility, which, however, did not meet the criteria for identifiability and control and, therefore, could not be recognized as an asset. This standard also provided for amortization of goodwill. In 2004, a new standard of IFRS 3 "Business Combinations" was issued, which replaced IAS 22 and prohibited the accounting of goodwill by the merger method.
In accordance with the rules established by the above-mentioned standard, the goodwill of the acquiring organization must be accounted by using the Purchase Method (it is necessary to note that the international standard permits the write-off of the value of goodwill, also at the time of acquisition of the firm from reserves). The use of this method consists in bringing value of the property of the acquired organization and sources of its formation to their net current market value by revaluation as of date when the merger or acquisition transaction was finalised. The amount paid for the acquired enterprise is taken in the resulting integrated structure as a new accounting base for the evaluation of existing assets. Besides, goodwill does not get amortized, but is annually (or more frequently as appropriate) tested for impairment. RAS considers the acquired goodwill as a kind of intangible asset, which along with other assets should be amortised. Thus, there is a gap between Russian and international standards of accounting of business reputation [2].
According to the international financial reporting standards, goodwill is calculated in several stages:
1. Estimation of the amount of revaluation of assets and liabilities to their current market value.
2. Establishing the market value of net assets.
3. Establishing the goodwill by calculation as the difference between the cost of acquisition of a firm and the market value of its net assets.
4. Estimation of the value of how much the cost of acquiring an enterprise exceeds its market value. This amount, a positive goodwill, is recognized as an asset on the balance sheet. Determining the useful life of this asset is the responsibility of the company's management.
4.2 Badwill
In the event of a negative business reputation (badwill), this asset is treated as income of future periods. The reason for the negative business reputation may be caused by several factors: understating the value of liabilities, overstating the value of assets, anticipation of losses in the future, impairment of securities. Badwill characterizes the low profitability relative to similar enterprises in the industry. Therefore, the value of the enterprise is estimated to be lower than the value of its assets. In RAS, negative business reputation should be a discount to the price given to the buyer due to the absence of stable buyers, reputation for quality, marketing and sales skills, business relationships, management experience, staff qualifications, etc. according to PBU 14/2007 (Intangible Assets Accounting).
We can conclude with confidence that there is no single methodology for calculating business reputation, since to date, there is still no consensus on its definition. Disputes about its synergetic principle, components, recognition and assessment have not abated among scientists for the second century. This is directly related to the variety of existing methods of assessing business reputation, which can be conditionally differentiated into qualitative and quantitative methods of calculating goodwill [3].
Qualitative methods include:
The method of expert evaluation consists of drawing up an expert opinion on the ratings of the business reputation of various companies. Typically, such ratings are produced by independent established agencies. The disadvantage of this method is its subjectivity, as well as low awareness of the nuances of the company's activities, its hidden potential, which sometimes can only be assessed by the owners of the company.
The method of sociological surveys is to analyze the opinions of employees, shareholders, investors, analysts, buyers, etc. about the organization. It is believed that this assessment is the most accurate, and the remaining methods are only able to clarify the situation. However, we believe that this method does not allow to provide quantitative information on the cost of goodwill. In addition, people's opinion can be very subjective and detached from reality, which casts doubts on the appropriateness of using this method in estimating the value of goodwill. Another disadvantage of this method is the time and effort spent on obtaining data and processing it [6].
4.3 Comparative method
Comparative method is to assess the image of the enterprise in question in comparison with the image of another enterprise, usually a similar or direct competitor. A significant drawback is the fact that it is not always possible to accurately and comprehensively evaluate all factors influencing the business reputation of the company under consideration and the one being compared, which can substantially distort the obtained data and cast doubts on its reliability.
Quantitative methods can give a more reliable valuation of the business reputation of the organization [8].
These include:
1. The method of excess profits.
2. The Edwards-Bell-Ohlson model (EBO).
3. The method of surplus resources.
4. Based on the sales volume index.
5. Based on the cost of goods sold indicator.
6. Qualimetric method.
7. Based on the market capitalization indicator.
8. Balance-normative method.
The method of excess profits was set out by L.Ratel in 1924. For assessment of goodwill it was submitted by the Tax Office and introduced by the Ministry of Finance in the United States. This method assumes that the firm's value is determined by summing the amount of goodwill and the adjusted net assets of the enterprise. The excess profit of the enterprise can be accounted for at the capitalization rate. In the US tax administration's instruction No. 68-609, capitalization rates for tangible and intangible assets were set by directive. For organizations with a low level of risk, the capitalization rate is 8% for tangible assets and 15% for intangible assets. For organizations with a high level of risk - 10% and 20%, respectively. However, in domestic practice, legislation does not adopt such coefficients, which leads to the use of average indicators of competing enterprises [1].
The essence of this method is to determine the possibility of obtaining an indicator of profit above the industry average, i.e. the excess or superprofit indicator which occurs due to goodwill as a projection of the synergistic effect. However, this methodology is based on the average statistics, which casts doubt on the reliability of the data.
GW = (M-RА × ANG) / RK, (1)
where GW is the amount of goodwill;
M - net profit of the enterprise;
RA - average industry return on net assets;
ANG - net adjusted assets;
RK - the capitalization rate.
The value of an enterprise is determined by summing up the value of tangible assets and goodwill.
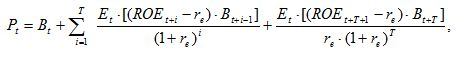
The modification of the excess profit method is the Edwards-Bell-Ohlson valuation model (EBO model), which closely resembles the EVA (economic value added) model and is based on economic value added. This methodology is also based on the possibility of obtaining extraordinary profits from existing goodwill, but Olson believed in the probabilistic nature of super profits, therefore he proposed his own methodology model, adjusted by the mathematical probability:
 (2)
(2)
where Pt - the value of the enterprise at time t;
Bt - book value of net assets (book value) of the enterprise at time t;
T - the end of the forecast period;
i - the period of existence of the enterprise;
Et- expected net income;
ROEt + 1 - return on equity for the period t + I (in fact, this is the ratio of profit after tax to the book value of share capital);
re - cost of equity (in essence, this is the expected return on capital employed by shareholders);
Bt + i-1 - book value (net asset value) of the enterprise by the beginning of the period t + i;
ROEt + T + 1 - return on equity of the enterprise by the end of the forecast period;
Bt + T - book value of the enterprise at the end of the forecast period.
It is worth noting that the accuracy of the forecast is significantly reduced with the expansion of the forecast horizon. However, this phenomenon does not apply to the EBO model since the net assets of the organization occupy a comparatively large share, while only goodwill is forecasted. The advantage of this model for domestic practice is undoubtedly the fact that this model allows the most reliable estimate of the value of money invested in real assets, as well as gives an idea of what part of the market value of the company is due to its goodwill.
The method of surplus resources in calculating the value of internally generated goodwill considers the effect of using both own and attracted funds:
GW = (M / R-TA) × w (3)
where R - return on assets of the enterprise;
TA - the value of the total assets of the enterprise;
w - the share of own funds in the sources of formation of the company's assets.
The method of surplus resources, in fact, is a modification of the excess profit method, hence it has the same drawbacks.
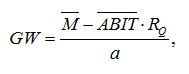
To use the goodwill estimation method based on the volume of sales, it is necessary to know the industry average profitability indicators. The cost of goodwill is determined by the formula:
 (4)
(4)
where M ̅ is the average annual net profit of the enterprise;
(ABIT) ̅- average annual revenue of the evaluated enterprise;
RQ - average industry profitability ratio of products (works, services);
a - coefficient of capitalization of excess profit of the enterprise.
The use of average indicators in this method leads to an error.
The essence of the method of estimating goodwill based on the cost of goods sold indicator consists in determining the interrelationship between the indicators of net profit and cost of goods sold. This is based on the assumption that the manifestation of a set of unique intangible advantages at the stage of distribution of a product is a manifestation of business reputation. Since the method is based on the cost of goods sold indicator, its main disadvantage is that it can be applied, with a low probability of reliability, to companies that provide communication services, insurance services, banks, etc.
5. Qualimetric method
The qualimetric method is based on the identity of the concepts of goodwill and utility of the enterprise.
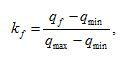 (5)
(5)
where kf - is the utility coefficient of the enterprise;
qf - actual indicator of the enterprise;
qmin - the worst indicator among similar enterprises;
qmax - the best indicator among similar enterprises.
Since depreciation is interpreted as an indicator of loss of utility, the general wear and tear of the enterprise is determined to establish the value of goodwill:
V=1–(NOIf /NOIpr) (6)
where V - is the general wear of the enterprise;
NOIf - the company's net operating income;
NOIpr - the projected value of the company's net operating income, which is defined as the deviation of the maximum net operating income from its lowest possible level.
Hence the goodwill is determined by the formula:
GW= V – Vf – IA (7)
where Vf - physical depreciation of non-current assets of the enterprise;
IA - the value of intangible assets of the enterprise.
The method of estimating goodwill based on the market capitalization indicator allows the acquisition of shares for the financial management of the company.
GW = m × C – ANC (8)
where m - the number of shares issued by the company;
C - current stock price of the company at the time of valuation;
ANC - the market value of the company's net assets at the valuation date.
If the company issues several types of shares (ordinary, preferred), the formula will be:
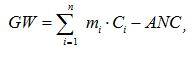 (9)
(9)
where n - is the number of types of shares of the company;
mi - the volume of issued shares of the i-th type;
Ci - is the stock price of the i-type;
ANC - the market value of the company's net assets.
This method is applicable only for joint-stock companies, if the company is not fully controlled by one shareholder.
6. Accounting method
The regulatory accounting method can be differentiated into:
1. Accounting method by which the goodwill is calculated as an arithmetic difference between the purchase price and the book value of assets. One of the significant drawbacks of this method is the lack of identification of goodwill from simply an overpayment, at the same time this method does not allow to consider an internally created business reputation.
2. The cost method, which is based on accounting of the costs of preparing and using business reputation. It includes the costs of staff training, the implementation of management, marketing and other technologies. It is worth noting that not all costs incurred lead to the creation of a new intangible asset - business reputation. In addition, the costs that can still be attributed to the creation of goodwill, form the goodwill indirectly and cannot be fully attributed to the creation of goodwill. It is not possible to write them off proportionally to one or another base.
Having analyzed the above, we can conclude that there is no single calculation methodology for assessing business reputation. The methods known now are not universal, and accordingly do not consider the specifics of the various businesses. It should also be noted that all these methods do not consider the factors that directly affect value of goodwill, for example, a successful choice of geographical location, the firm's market share, management reputation, and employee qualifications. Each of the methods, covering one of the aspects of goodwill, does not consider the entire composition of its key features. All this greatly complicates the reflection of business reputation, both acquired and internally generated, in the financial statements.
Having reflected on the existing methods for assessing business reputation, it can be concluded that several factors that form an internally created goodwill are often ignored. Among the main reasons for not considering the important characteristics of it are the following: the lack of a clear list of factors shaping the business reputation and the complexity of their full and reliable assessment. In addition, it is logical to assume that the set of factors may vary depending on the size of the company, industry, organizational form of the company.
Thus, the use of aggregate methods for analyzing the financial condition, methods of assessing the value of the company and its business reputation during economic analysis will enable the financial manager to better evaluate the performance of the organization and, based on the results obtained, make the most competent management decision during strategic planning.
1. Агапова Т.Н., Музалёва Т.И. Использование статистических методов для оценки влияния социально-экономических показателей на уровень преступности в стране // Вестник Поволжского государственного университета сервиса. 2012. №23. С. 48-51.
2. Дианов Д., Суглобов А., Дятлова А. Применение статистических методов в исследовании деятельности убыточных организаций // Международная научная конференция «Инвестиции, строительство, недвижимость: новые технологии и целевое развитие», Иркутск, Россия, 26-27 апреля 2018.
3. Дианов Д.В., Суглобов А.Е., Кузнецова Е.И., Русавская А.В., Минаков А.В. Статистический инструментарий для оценки финансовой безопасности регионов // Международный журнал по технике и технологиям (ОАЭ), 2018, 7 (3.15), с. 230-232.
4. Музалев С.В. Особенности использования методов статистического анализа в деятельности организации // В сборнике: Анализ и современные информационные технологии в обеспечении экономической безопасности бизнеса и государства Сборник научных трудов и результатов совместных научно-исследовательских проектов. РЭУ им. Г.В. Плеханова. -М., 2016. с. 263-272.
5. Музалев С.В. Рекомендации по использованию западных и российских моделей анализа оценки вероятности банкротства организаций//Вестник Университета (Государственный университет управления). 2008. № 10 (20). С. 136-145.
6. Музалев С.В., Звонарёва Н.С. Использование анализа структурных сдвигов баланса в оценке деятельности нефтяных компаний // Современные технологии управления - 2014. Сборник материалов международной научной конференции. Россия, Москва, 14-15 июля 2014 г. [Электронный ресурс] / под ред. проф. А.Я. Кибанова. - Электрон. текст. дан. (1 файл 16,6 Мб). - Киров: МЦНИП, 2014. - 2153 с
7. Суглобов А.Е. Музалёв С.В., Яремчук Е.А. Использование стратегического анализа для оценки эффекта от влияния санкций на экономику России // Вопросы региональной экономики. 2016г. №4 том 29. С. 130-137.
8. Юдина Л.Н. Современные подходы к определению составляющих и оценке гудвила (деловой репутации организации) при подготовке слияний и поглощений // Электронный научно-практический журнал «Экономика и менеджмент инновационных технологий» 2014 №9(36).
9. Яремчук Е.А. Экспресс-анализ, Защита данных: руководство [www.express-analysis.com].
